Phasics
- Wavefront, MTF and QPI measurement solutions
- Products
- Applications
- Markets
- Company
- Contact us
June 22, 2026
Cell growth is one of the most fundamental phenomena in life science research. Senescence, drug treatment, cell cycle arrest, immune activation, and metabolic stress can all lead to changes in cell area, volume, and morphology. When cells stop dividing, molecular markers like p21, p16, SA-β-gal, and SASP tend to shift accordingly.
But molecular markers alone cannot answer a more basic physical question: once a cell stops dividing, does its physical state stabilize too?
Senescent cells are known to increase in size. But does that enlargement reflect genuine biomass accumulation, or is it mainly due to volume expansion and dilution of cellular contents? In standard microscopy images, both scenarios can look identical. Yet they carry completely different physiological implications.
This is why dry mass matters. Dry mass captures the total non-water content inside a cell. It directly answers whether a morphological change is accompanied by real biomass accumulation. For research into cellular senescence, drug response, growth regulation, and metabolic reprogramming, dry mass is a more faithful indicator of cell state than area, shape, or fluorescence intensity alone.
A New Study from Harvard Medical School
In October 2025, a research team including Xili Liu, Matthew Sonnett, and Marc W. Kirschner published a bioRxiv preprint examining doxorubicin-induced senescence in human RPE-1 cells. Using quantitative phase microscopy, Normalized Raman Imaging (NoRI), and quantitative phosphoproteomics, the team systematically tracked dry mass, volume, mass density, and proteome remodeling throughout the senescence process.
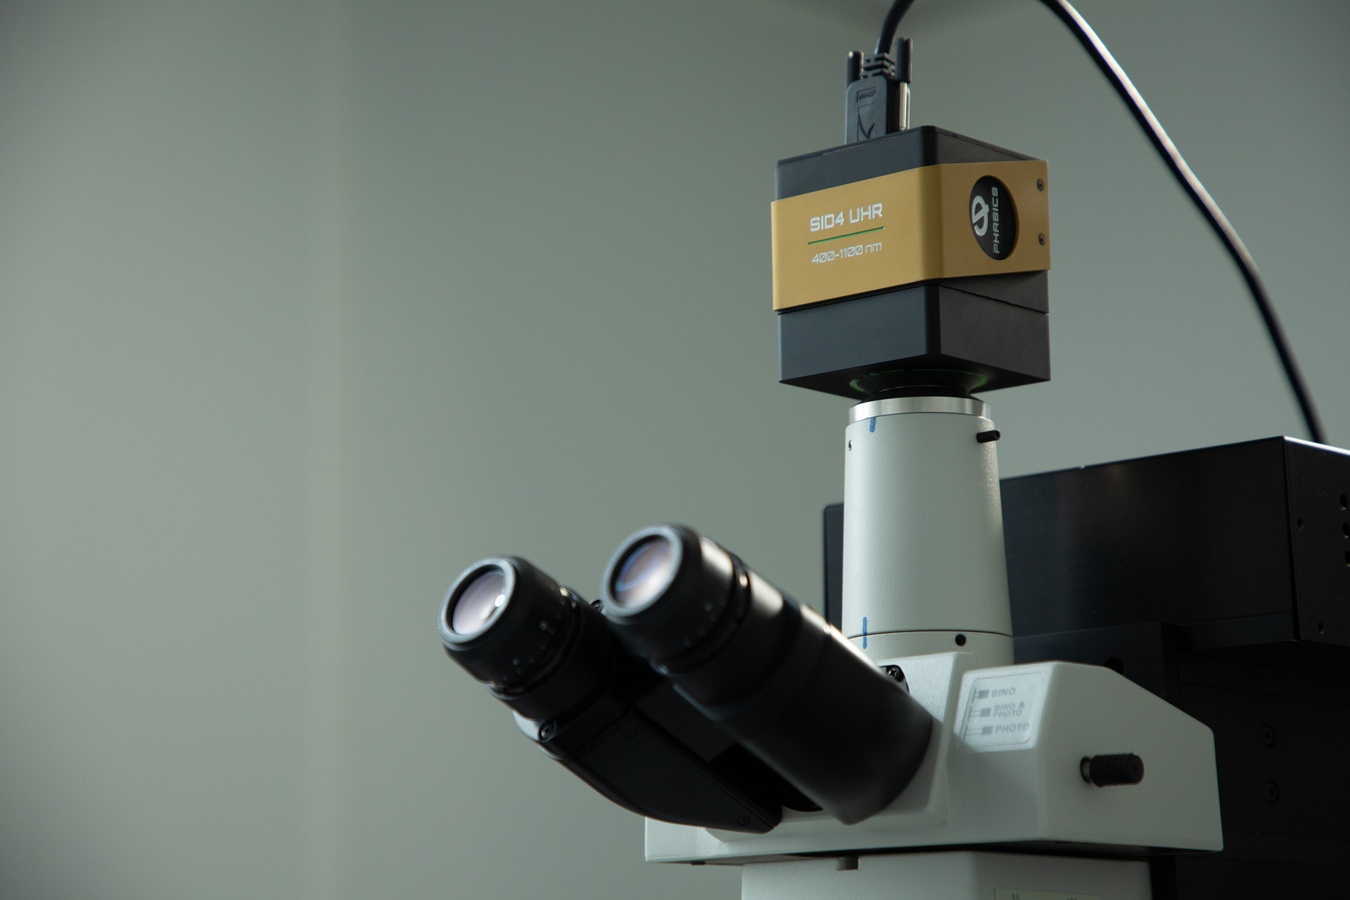
In this study, the Phasics SID4-sC8 camera was used for quantitative phase imaging, providing the label-free phase data needed to measure single-cell dry mass.
Why Standard Microscopy Is Not Enough
Brightfield, phase contrast, and fluorescence microscopy are well-established tools for visualizing cell morphology, spreading area, nuclear shape, and molecular markers. They are valuable for detecting whether cells have changed shape or are expressing senescence-associated proteins.
What they cannot do is directly report total non-water content. An increase in cell volume does not automatically mean an increase in dry mass. A brighter fluorescence signal does not tell you whether the cell has accumulated more biomass. For transparent cell samples, many critical physical changes are encoded in refractive index and phase information that standard intensity-based images simply do not capture.
This is the measurement gap the SID4-sC8 is designed to fill. It converts the phase delay introduced by transparent cells into a quantifiable optical path difference (OPD). Because intracellular refractive index correlates with solute concentration, integrating OPD across the cell footprint yields dry mass at the single-cell level.
What the Data Showed
In this study, the team used the Phasics SID4-sC8, which is based on quadriwave lateral shearing interferometry (QWLSI), to acquire quantitative phase maps of individual cells. These maps were then processed to calculate single-cell mass.
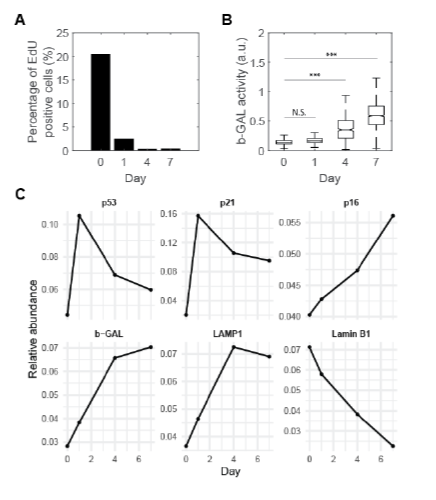
Figure 1. RPE-1 cells treated with doxorubicin enter cell cycle arrest and display hallmark senescence marker changes. (A) EdU incorporation drops sharply by Day 1 and is nearly absent by Days 4 and 7, confirming stable proliferative arrest. (B) SA-β-gal activity increases progressively over the same period. (C) Proteomic time courses show progressive changes in p53, p21, p16, β-gal, LAMP1, and Lamin B1, all consistent with classical senescence phenotype. Image credit: Liu et al., bioRxiv 2025, CC BY 4.0.
The results were striking. By Day 1 after doxorubicin treatment, EdU-positive cells had dropped significantly. By Days 4 and 7, DNA synthesis had nearly disappeared, confirming stable cell cycle arrest. At the same time, SA-β-gal activity increased progressively, and markers including p21, p16, LAMP1, and Lamin B1 all changed in ways consistent with classical senescence.
Quantitative phase imaging then provided a direct physical readout: despite having stopped dividing, senescent cells continued to accumulate dry mass.
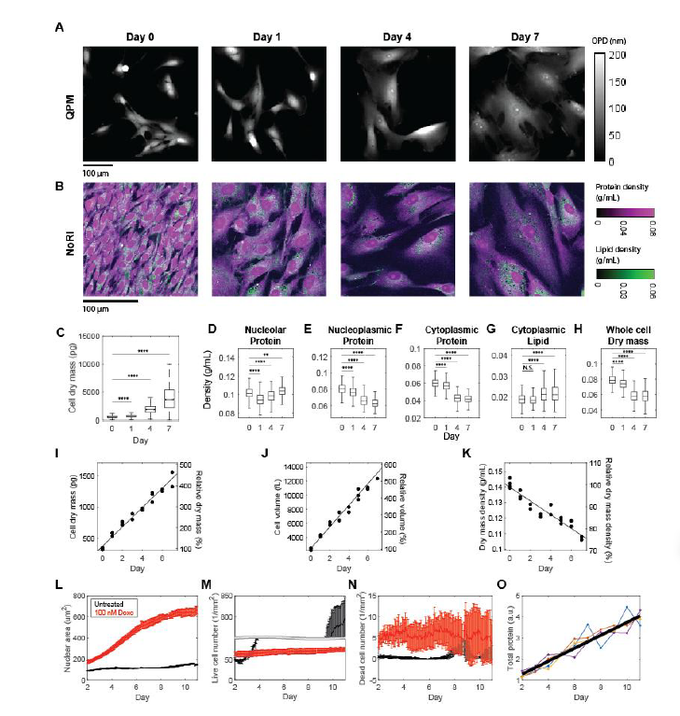
Figure 2. Quantitative phase microscopy (QPM) and Normalized Raman Imaging (NoRI) provide continuous characterization of RPE-1 cells following doxorubicin treatment. Image credit: Liu et al., bioRxiv 2025, CC BY 4.0.
By Day 7, average dry mass had risen from approximately 542 pg to 4,122 pg, reaching 7.6 times its initial value. This confirmed that the volume increase in senescent cells reflects genuine biomass accumulation, not simply morphological spreading or water retention. Quantitative phase microscopy turned that observation from a qualitative impression into measurable, statistically robust single-cell data.
The team tracked individual cells daily after trypsinization using quantitative phase imaging. Over the observation window, both dry mass and volume increased in an approximately linear fashion. Dry mass grew by roughly 46% per day, while volume grew by roughly 63% per day. Because volume outpaced dry mass, overall mass density declined at approximately 3% per day.
These findings reframe what cell cycle arrest actually means for cellular state. Senescent cells do not enter a static equilibrium once proliferation stops. They continue accumulating mass, expanding in volume, and drifting away from the tightly regulated mass density maintained in normal proliferating cells.
Uneven Growth Under the Surface
Further density analysis revealed that this growth is not a simple, proportional scale-up. The team used NoRI as a complementary method to assess protein and lipid mass density separately. While total dry mass increased, the internal composition shifted: protein density declined while lipid density rose, and overall mass density decreased. Senescent cells are not just bigger versions of their normal selves.
Proteome Remodeling at Scale
To understand the molecular basis of continued mass accumulation, the team performed quantitative proteomics over a 12-day window, quantifying approximately 5,000 proteins and clustering them by temporal trajectory.
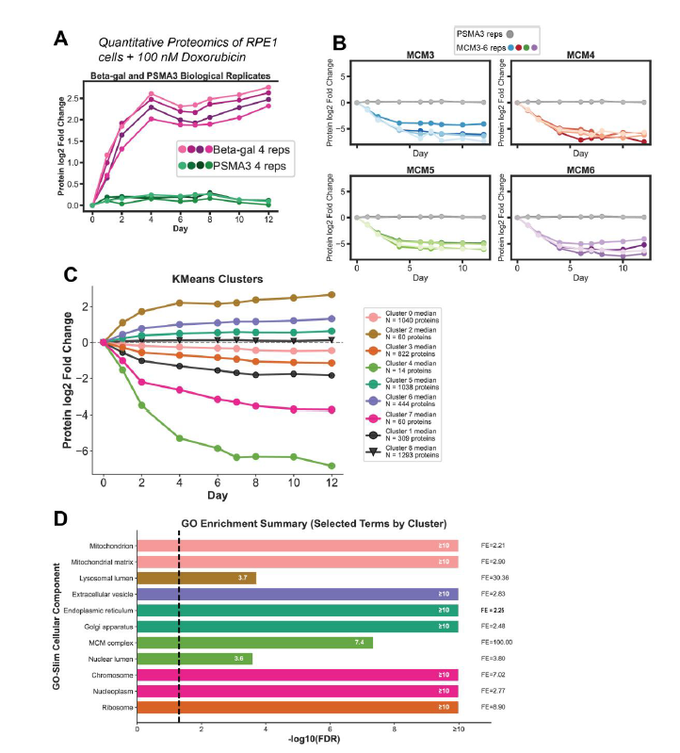
Figure 3. Quantitative proteomic profiling of RPE-1 cells treated with doxorubicin. Image credit: Liu et al., bioRxiv 2025, CC BY 4.0.
The results showed clear, uneven proteome remodeling. Proteins associated with lysosomes, the endoplasmic reticulum, and the Golgi apparatus increased over time, while nuclear and mitochondrial proteins declined. As senescent cells grew larger, membrane-bound organelles and secretory or degradative structures became relatively more prominent, while nuclear and mitochondrial components contracted in relative terms.
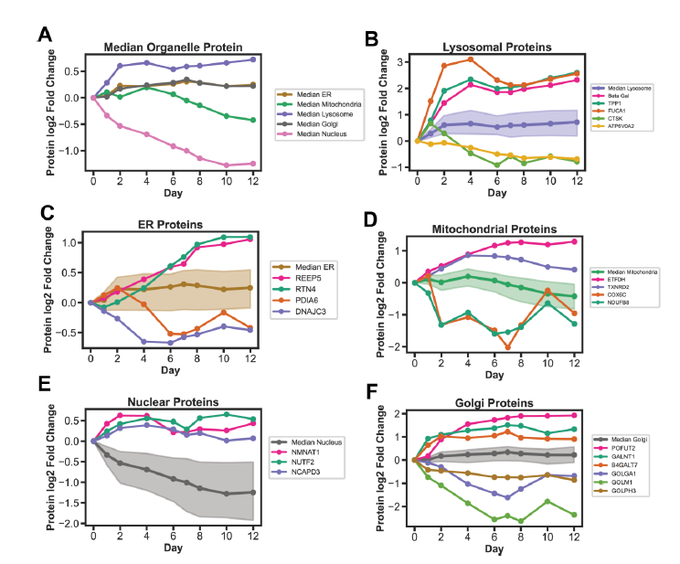
Figure 4. Organelle- and metabolism-specific protein scaling during senescence induction in doxorubicin-treated RPE-1 cells. Image credit: Liu et al., bioRxiv 2025, CC BY 4.0.
Phosphoproteomic analysis was used to infer kinase activity changes across this period. Multiple kinases involved in cell cycle regulation and RNA processing, including CDK and CLK family members, showed declining activity. In contrast, kinases linked to stress adaptation, DNA damage response, and cytoskeletal control, such as CAMK2D, DNAPK, MARK2, and MARK4, trended toward activation.
Taken together, the data build a picture of cellular senescence as an actively evolving state. Cell cycle arrest is not the end of the story. Cells continue accumulating mass, shifting in density, remodeling their organelle composition, and sustaining that state through stress and DNA damage signaling.
Why Dry Mass Measurement Belongs in Your Workflow
The relevance of these findings extends well beyond senescence research. In drug response studies, cells may stop proliferating while continuing to accumulate mass. In cell cycle research, whether cell size and mass growth remain coordinated is directly tied to understanding growth control mechanisms. In immune cell activation, metabolic reprogramming, and cellular stress studies, morphological changes need to be distinguished from real shifts in biomass.
The SID4-sC8 enables researchers to obtain single-cell dry mass data without labels, converting morphological observations into quantifiable physical readouts. This kind of data supports analysis of whether cells are genuinely accumulating biomass, how cell state changes under different treatment conditions, and whether population heterogeneity is emerging in ways that other methods would miss.
If you are working on questions like these, or want to learn more about how the Phasics SID4-sC8 can support your research in dry mass measurement, OPD phase mapping, live-cell monitoring, or label-free quantitative imaging, we would be glad to hear from you. [Contact us here.]
Reference
Xili Liu, Matthew Sonnett, Marc W. Kirschner. Unbounded Cell Growth and Proteome Imbalance in Doxorubicin-Induced Senescent RPE-1 Cells. bioRxiv, 2025.