Phasics
- Wavefront, MTF and QPI measurement solutions
- Products
- Applications
- Markets
- Company
- Contact us
July 25, 2025
In developing new therapeutic drugs, researchers frequently encounter the critical challenge of accurately monitoring early-stage cellular responses without disturbing cellular states. The ability to detect rapid physiological changes such as sensitivity and toxicity to treatments is essential. Traditional approaches like metabolic dyes, fluorescence tagging, or antibody staining, although widely used, usually only offer endpoint measurements and suffer from issues like dye interference, photobleaching, and limited reproducibility. Even though alternative label-free methods such as electrical impedance spectroscopy, dynamic light scattering, or total internal reflection interference microscopy have found success in specific applications, they often struggle with limitations in spatial resolution or suitability for simultaneous analysis of cell dry mass, metabolic activity, and high-throughput imaging. Researchers have thus urgently sought a more precise, rapid, and scalable solution.
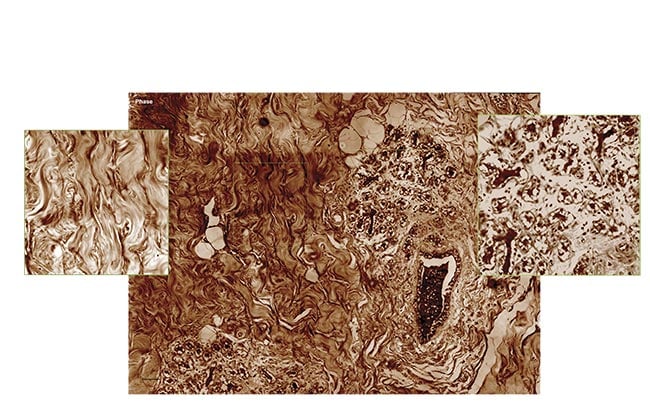 |
Fig.1: Quantitative phase imaging (QPI) produces a slice of tumorous mouse skin at 40× magnification (scanned and stitched to obtain a 5000 × 5000 pixel image). Courtesy of Phasics
Quantitative Phase Imaging (QPI) technology emerges as a transformative approach, enabling researchers to track changes in cell mass without any labeling or staining.
A recent experiment, employing a Phasics SID4-Bio camera based on QPI, monitored HEK cells treated with varying concentrations of the apoptosis-inducing drug staurosporine. Traditional toxicity assays typically involve prolonged incubations across multiple cell cycles, often exceeding 20 hours to count surviving cells post-treatment. QPI revolutionizes this by measuring cell dry mass directly, a powerful indicator of cellular health and proliferation capability. Within just a few hours, differences in growth rates became apparent, enabling rapid evaluation of drug toxicity and determination of effective therapeutic windows. This significantly accelerates drug screening timelines, providing clear advantages over conventional cell-counting or dye-based methods.
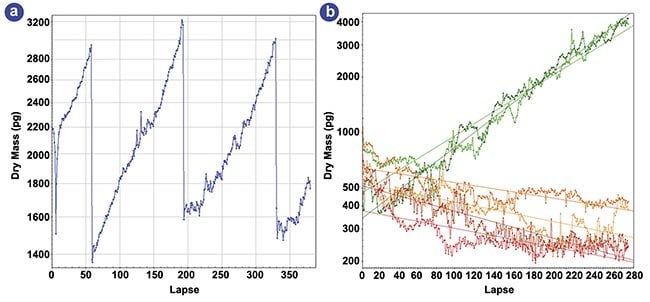 |
Fig.2: Dry-mass evolution of HEK cells under various staurosporine concentrations. A four-day evolution of the dry mass of a single HEK cell (a). A six-day evolution of the dry mass of a few hundred HEK cells for various staurosporine concentrations (b). Adapted with permission from Reference article S. Aknoun et al.Sci Rep, Vol. 11, No. 1. p. 4409.
Furthermore, high-speed QPI has demonstrated its capability to detect behavior heterogeneity within tumor cell populations, a significant obstacle in effective cancer treatments. Cellular heterogeneity the varied responses among cells to the same therapeutic agent, is frequently responsible for treatment failure and drug resistance. QPI allows researchers to distinguish cellular subpopulations with different metabolic responses shortly after drug exposure. Some cells exhibit early growth arrest, while others swiftly resume growth, indicating potential drug resistance. This capability of identifying these critical variations within hours, rather than days, provides a powerful predictive tool far superior to traditional endpoint analyses.
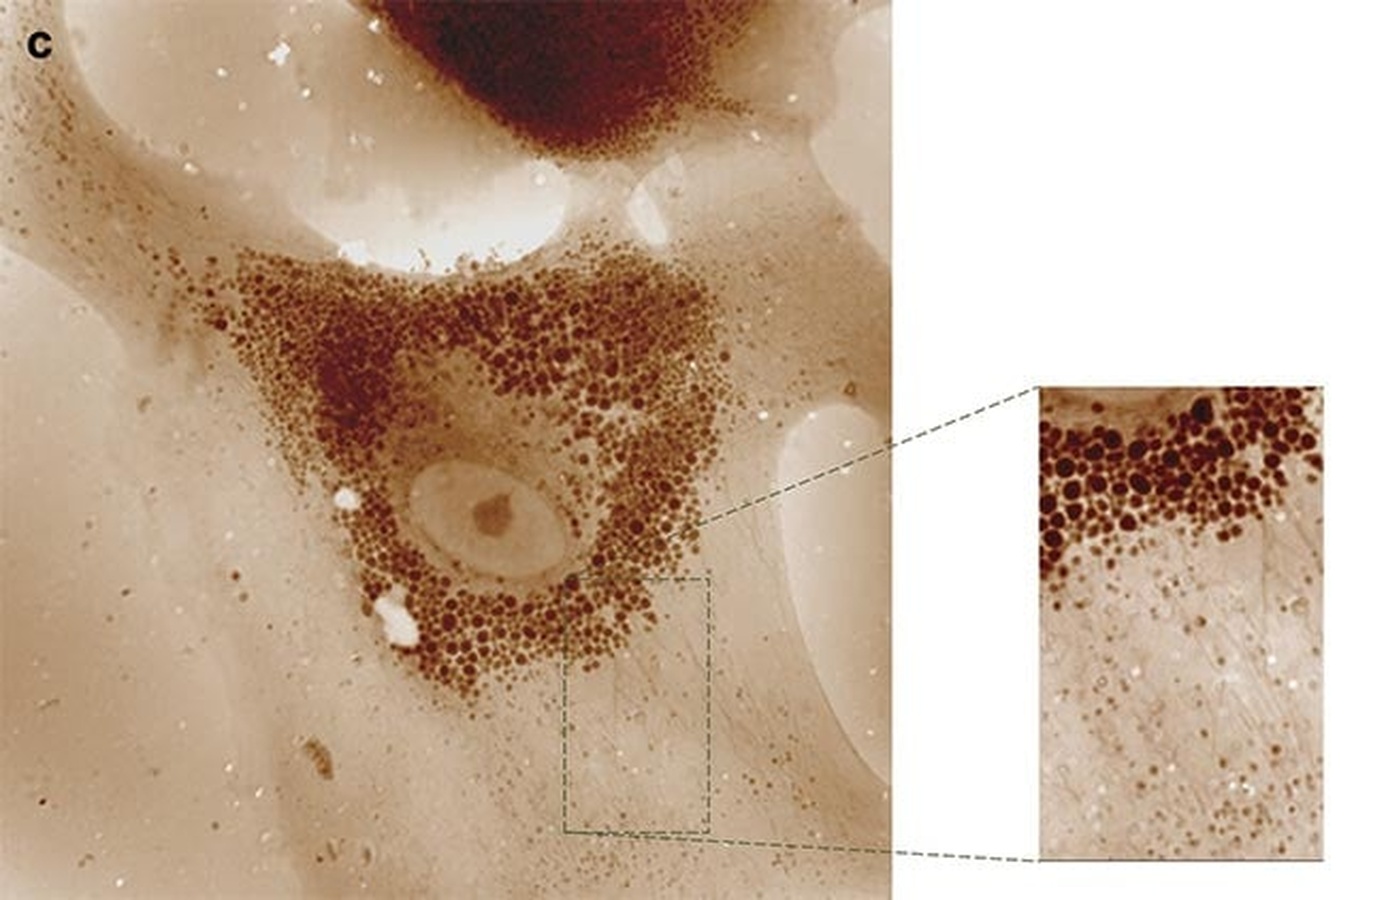
Beyond cellular analysis, QPI also excels in imaging tissue structures without staining, a valuable asset in histological research. By leveraging phase-sensitive polarization imaging, researchers generate retardance maps that identify anisotropic collagen networks within tissues. For example, in melanoma studies, researchers observed significant differences in collagen fiber orientation between healthy and tumor tissues. Such structural features directly correlate with tumor malignancy grades, and QPI's stain-free imaging approach markedly enhances histological analysis efficiency and reproducibility.
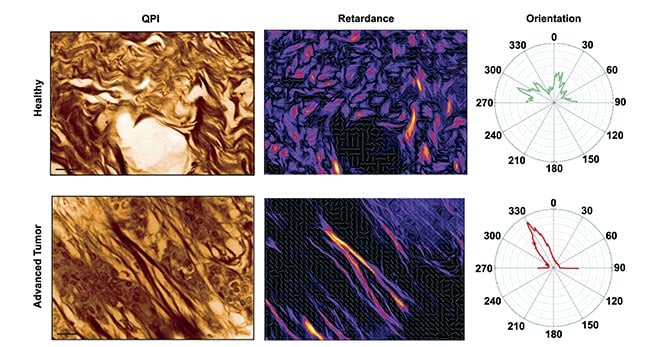 |
Fig.3: Quantitative phase imaging (QPI) (left) and retardance (right) of a mouse skin tissue for a healthy (top) and advanced tumor (bottom) sample. Only collagen fibers are revealed in the retardance image, whereas cells disappear. Radar representations of fiber orientation for both conditions are also shown. Courtesy of Phasics.
These advancements stem from Phasics' proprietary Quadriwave Lateral Shearing Interferometry (QWLSI) technology. Unlike traditional interferometers dependent on external reference paths, QWLSI integrates seamlessly into standard microscopes, delivering high-resolution phase images immune to vibrations and thermal drift. The SID4-Bio camera captures both intensity and phase information in a single acquisition, producing high-contrast, detailed images readily analyzed by advanced software tools. This platform thus robustly supports diverse biological research applications from dynamic cellular response analysis to precise drug mechanism studies.
As machine learning techniques continue evolving, QPI-generated data increasingly integrates into sophisticated biological analyses. Studies have already shown improvements in cell classification accuracy by using phase texture as input features. Additionally, QPI's absence of photobleaching enables extended observation of dynamic cellular organelles like mitochondria and endoplasmic reticulum, significantly enhancing research into cellular metabolism, aging, and drug response mechanisms.
To explore QPI’s applications further whether in toxicity evaluation, drug resistance research, or detailed tissue structural analysis visit our website or contact us for product information and demonstrations.
Read the full article here.
References
1. E. Cuche et al. (1999). Digital holography for quantitative phase-contrast imaging. Opt Lett, Vol. 24, No. 5, pp. 291-293.
2. P. Bon et al. (2009). Quadriwave lateral shearing interferometry for quantitative phase microscopy of living cells. Opt Express, Vol. 17, No. 15, pp. 13080-13094.
3. J. Primot and N. Guérineau. (2000). Extended Hartmann test based on the pseudoguiding property of a Hartmann mask completed by a phase chessboard. Appl Opt, Vol. 39, No. 31, pp. 5715-5720.
4. S. Aknoun et al. (2015). Living cell dry mass measurement using quantitative phase imaging with quadriwave lateral shearing interferometry: an accuracy and sensitivity discussion. J Biomed Opt, Vol. 20, No. 12, p. 126009.
5. S. Aknoun et al. (2021). Quantitative phase microscopy for non-invasive live cell population monitoring. Sci Rep, Vol. 11, No. 1. p. 4409.
6. D. Huang et al. (2018). High-speed live-cell interferometry: a new method for quantifying tumor drug resistance and heterogeneity. Anal Chem, Vol. 90, No. 5, pp. 3299-3306.
7. S. Aknoun et al. (2015). Quantitative retardance imaging of biological samples using quadriwave lateral shearing interferometry. Opt Express, Vol. 23, No. 12, pp. 16383-16406.